

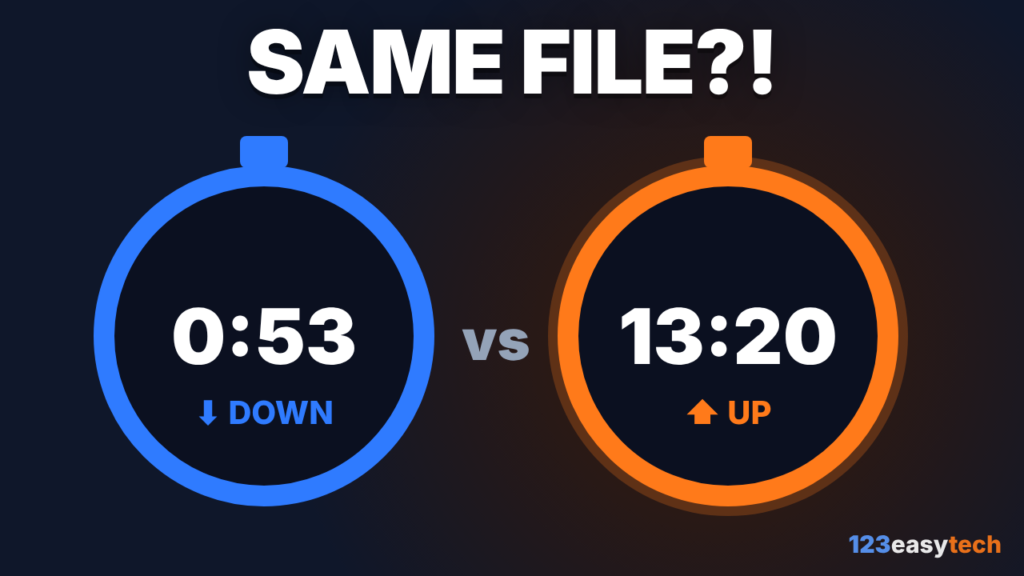
Short answer: your connection’s capacity is shared between the two directions, and because households download far more than they upload, cable, DSL, 5G and the most common fiber standard (GPON) give most of that capacity to downloads. Your plan’s speed tier then caps upload lower still. Newer fiber (XGS-PON) and upgraded cable networks are starting to close the gap.
Here is what that looks like in practice. Take a 2 GB video on a plan rated 300 Mbps down and 20 Mbps up. Downloading it takes about 53 seconds. Uploading the same file takes about 13 minutes 20 seconds, fifteen times longer.
Ideal-case math: 2 GB = 16,000 megabits. 16,000 ÷ 300 = 53 s; 16,000 ÷ 20 = 800 s. Real transfers run a little slower because of protocol overhead.
Watch: the 3-minute animated explainer.
Step 1: one connection, two directions
Data coming to you (downstream) and data leaving you (upstream) travel over the same thing: one coax cable, one copper phone line, one strand of fiber, or one slice of radio spectrum. That medium has a fixed amount of capacity, and engineers have to decide how much each direction gets.
Step 2: what people actually do
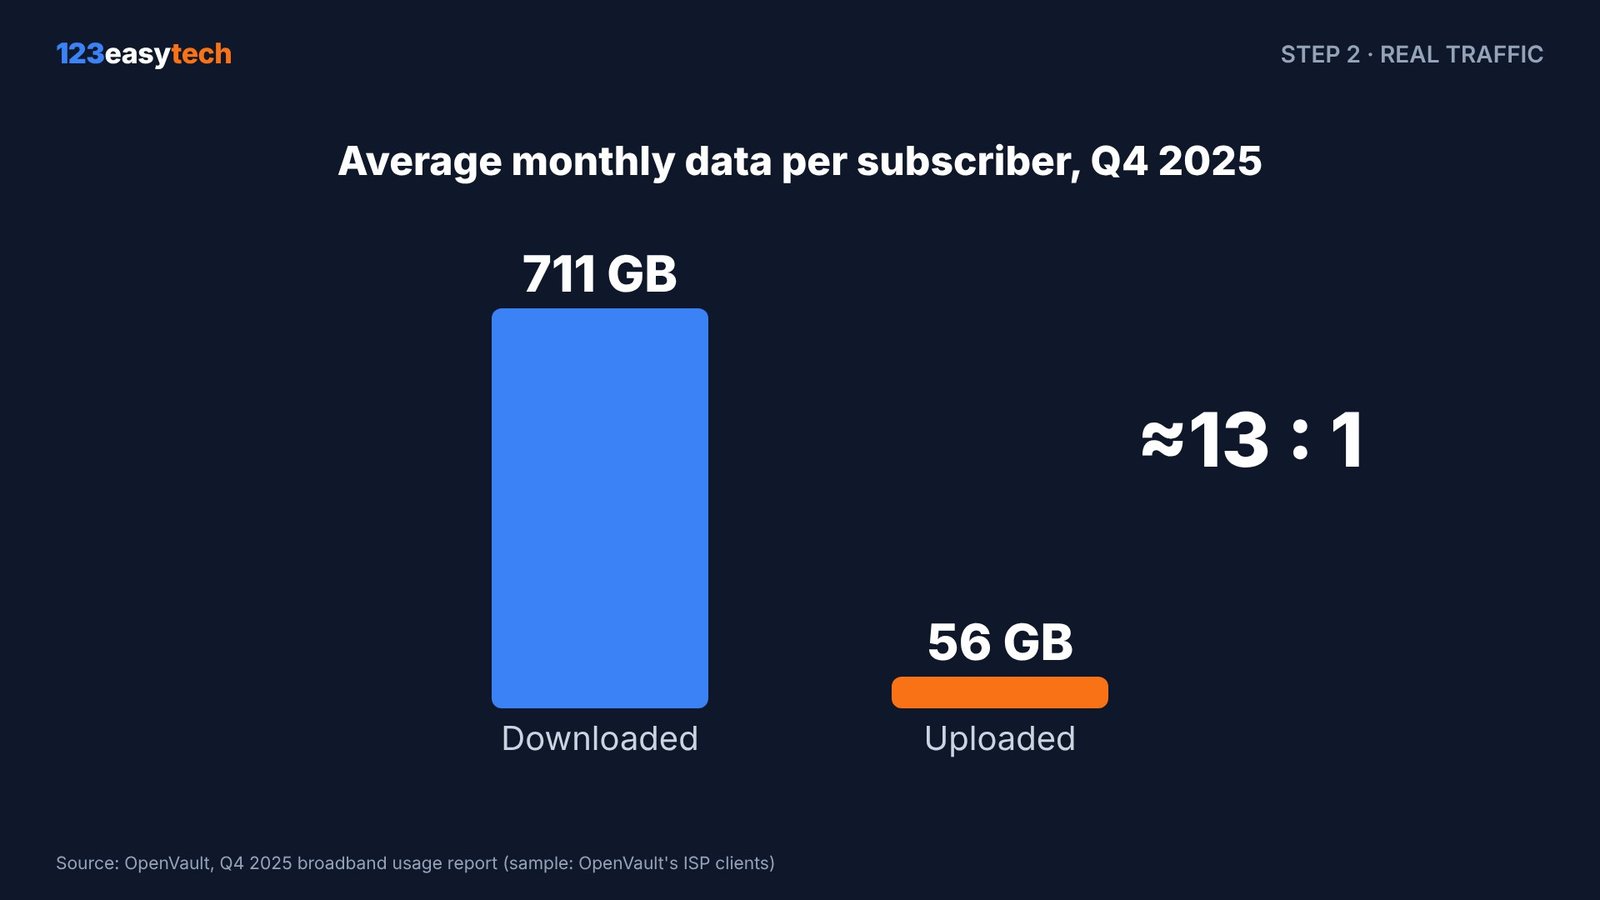
They size it to real traffic. Network analytics firm OpenVault reported that in the fourth quarter of 2025, the average subscriber in its data downloaded about 711 GB a month and uploaded about 56 GB. That’s roughly 13 to 1 (OpenVault, Feb 2026). The mobile industry body GSMA describes the same pattern: traffic is “often asymmetrical” because users download more than they upload (GSMA, 2020).
Step 3: the split is built into the technology
Cable: a small slice of the dial
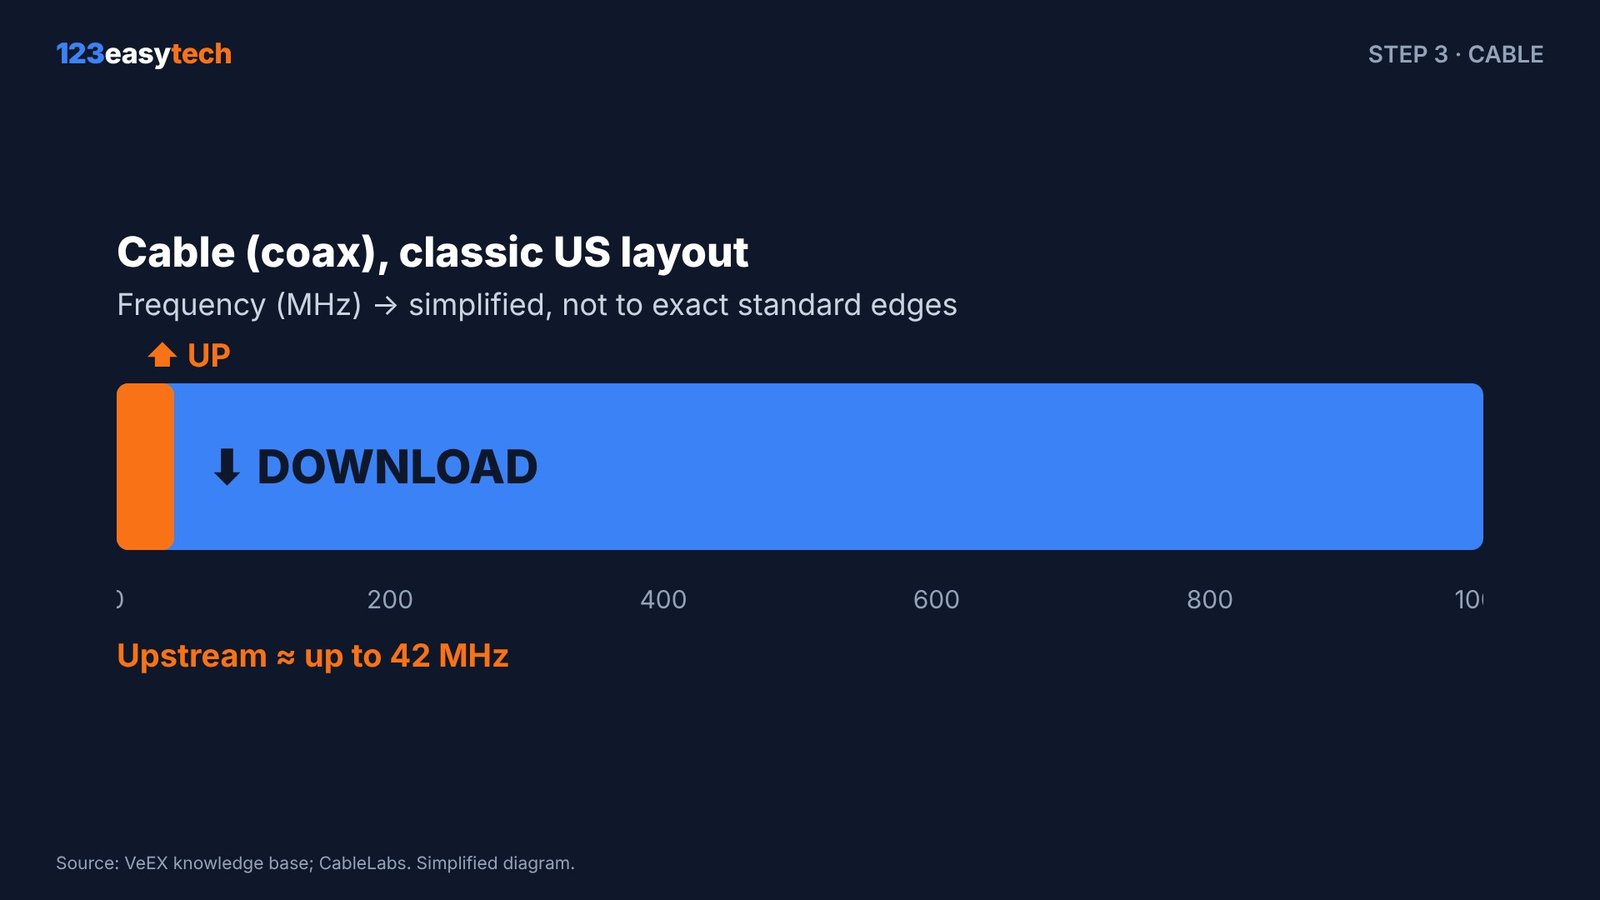
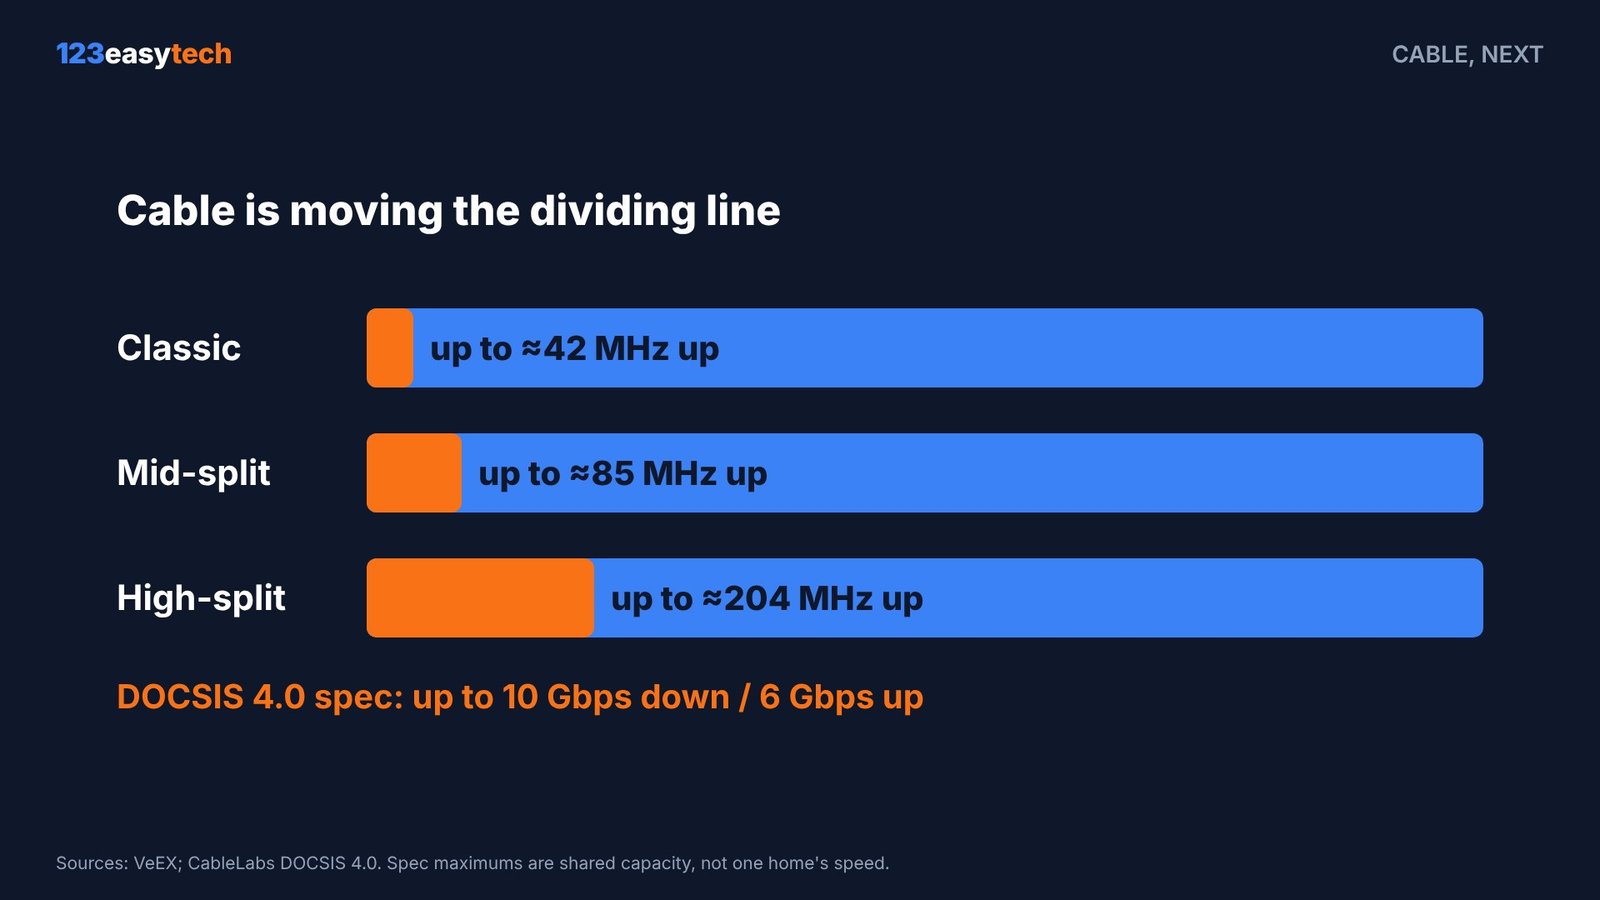
Cable internet carries signals at different frequencies on the coax, a bit like stations on a radio dial. In the classic U.S. layout, uploads get only the low end, up to about 42 MHz. Most of the spectrum above that goes to downloads (VeEX).
DSL: asymmetric by name
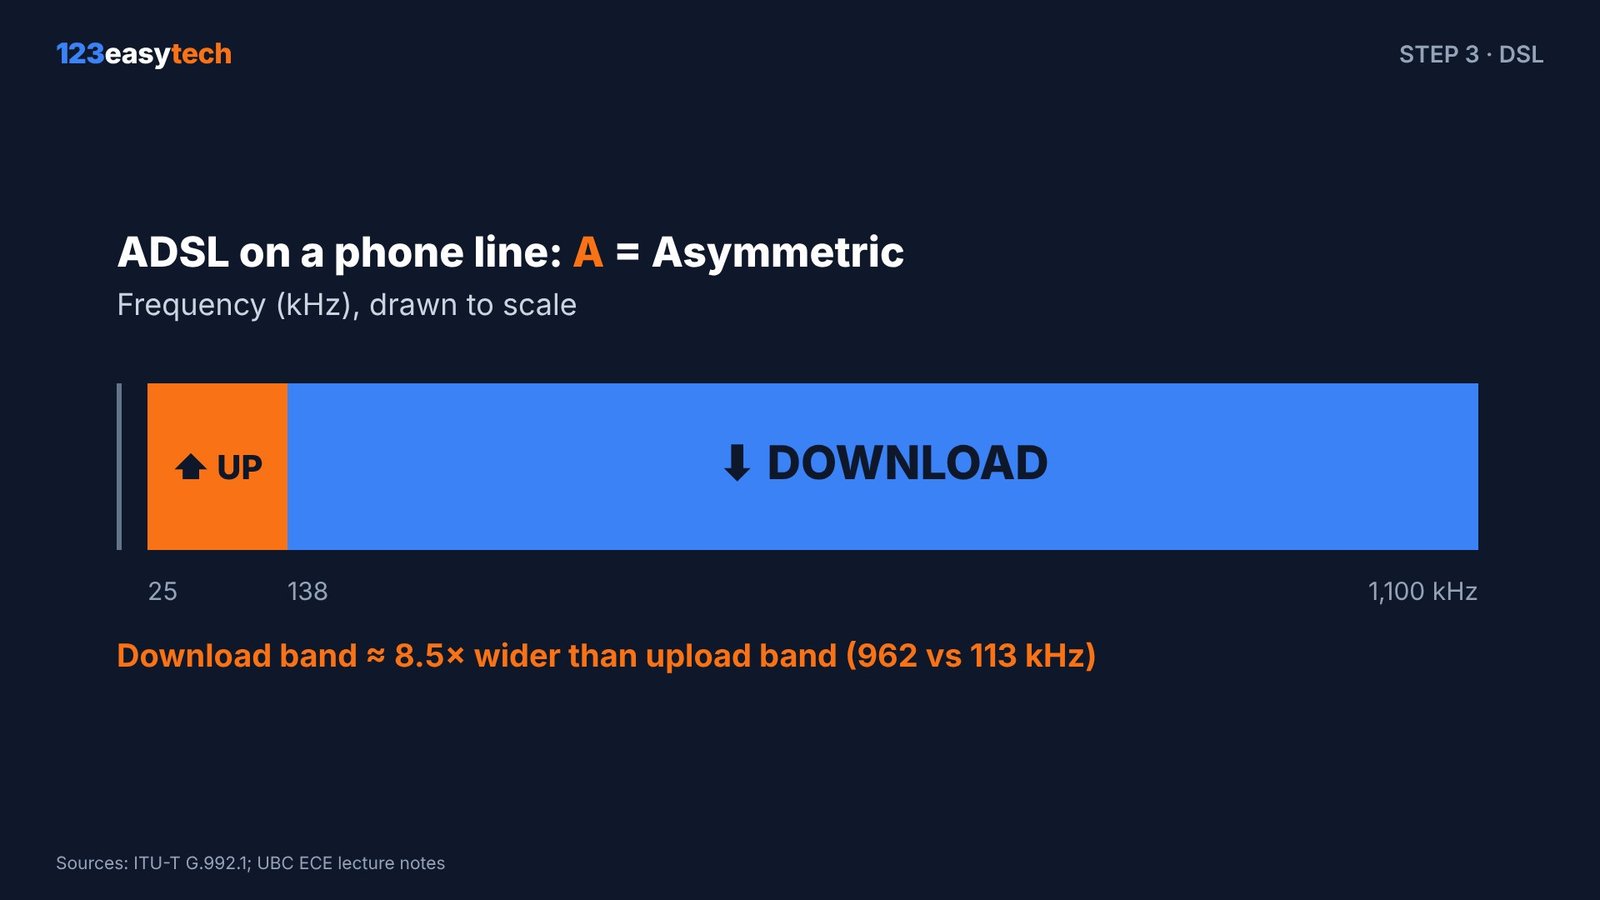
The “A” in ADSL stands for asymmetric. The ITU standard is literally titled “Asymmetric digital subscriber line (ADSL) transceivers” (ITU-T G.992.1). On the phone line, uploads use roughly 25–138 kHz and downloads use 138 kHz to 1.1 MHz (UBC lecture notes), so the download band is about 8.5 times wider.
5G: taking turns, mostly in one direction
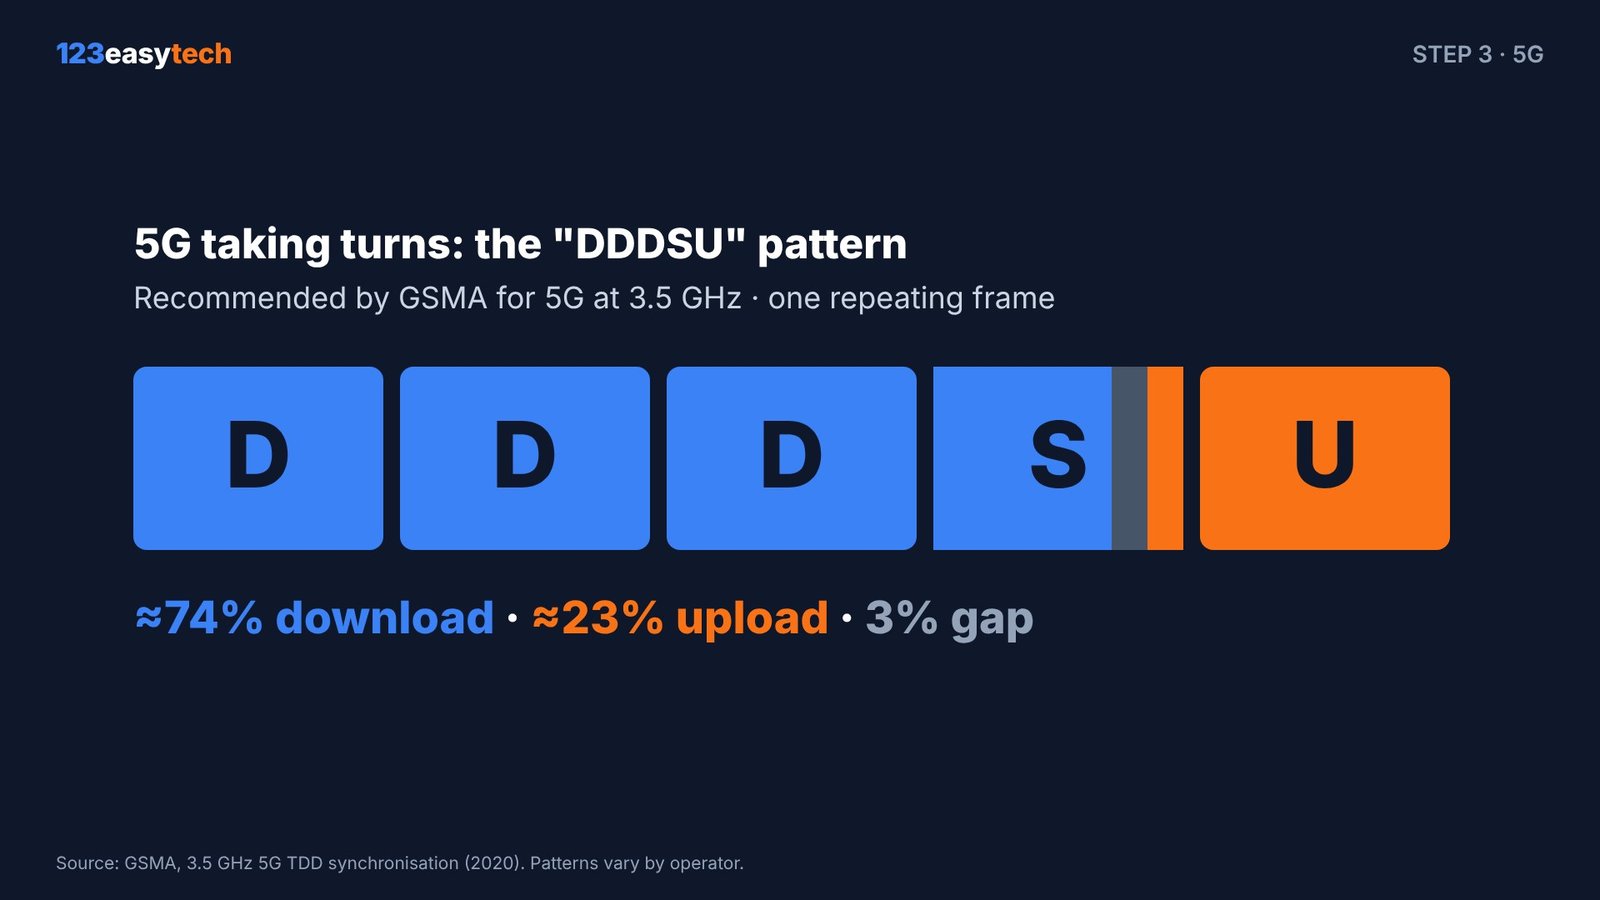
Most mid-band 5G uses time-division duplex: one channel, with the tower and phones taking turns. For 5G at 3.5 GHz, GSMA recommends a repeating “DDDSU” frame: three download slots, one special slot (mostly download), then one upload slot. Counting symbols, that’s about 74% download, 23% upload and 3% guard time (GSMA). Operators can use other patterns, so treat this as typical rather than universal.
The trade-off
Every slice given to upload is taken from download. Split capacity evenly and the direction almost everyone uses most would get slower. So the lopsided split is mainly an engineering choice that matches capacity to typical traffic. How a provider prices its tiers is a separate business decision.
Layer 2: your plan
On top of the technology, your provider sets a speed tier. In the U.S., the required broadband label lists a “Typical Upload Speed” separately from download (FCC label glossary). Even the FCC’s own broadband benchmark, raised in 2024, is 100 Mbps down and 20 Mbps up, a 5-to-1 ratio (FCC 24-27).
Why fiber can be symmetric
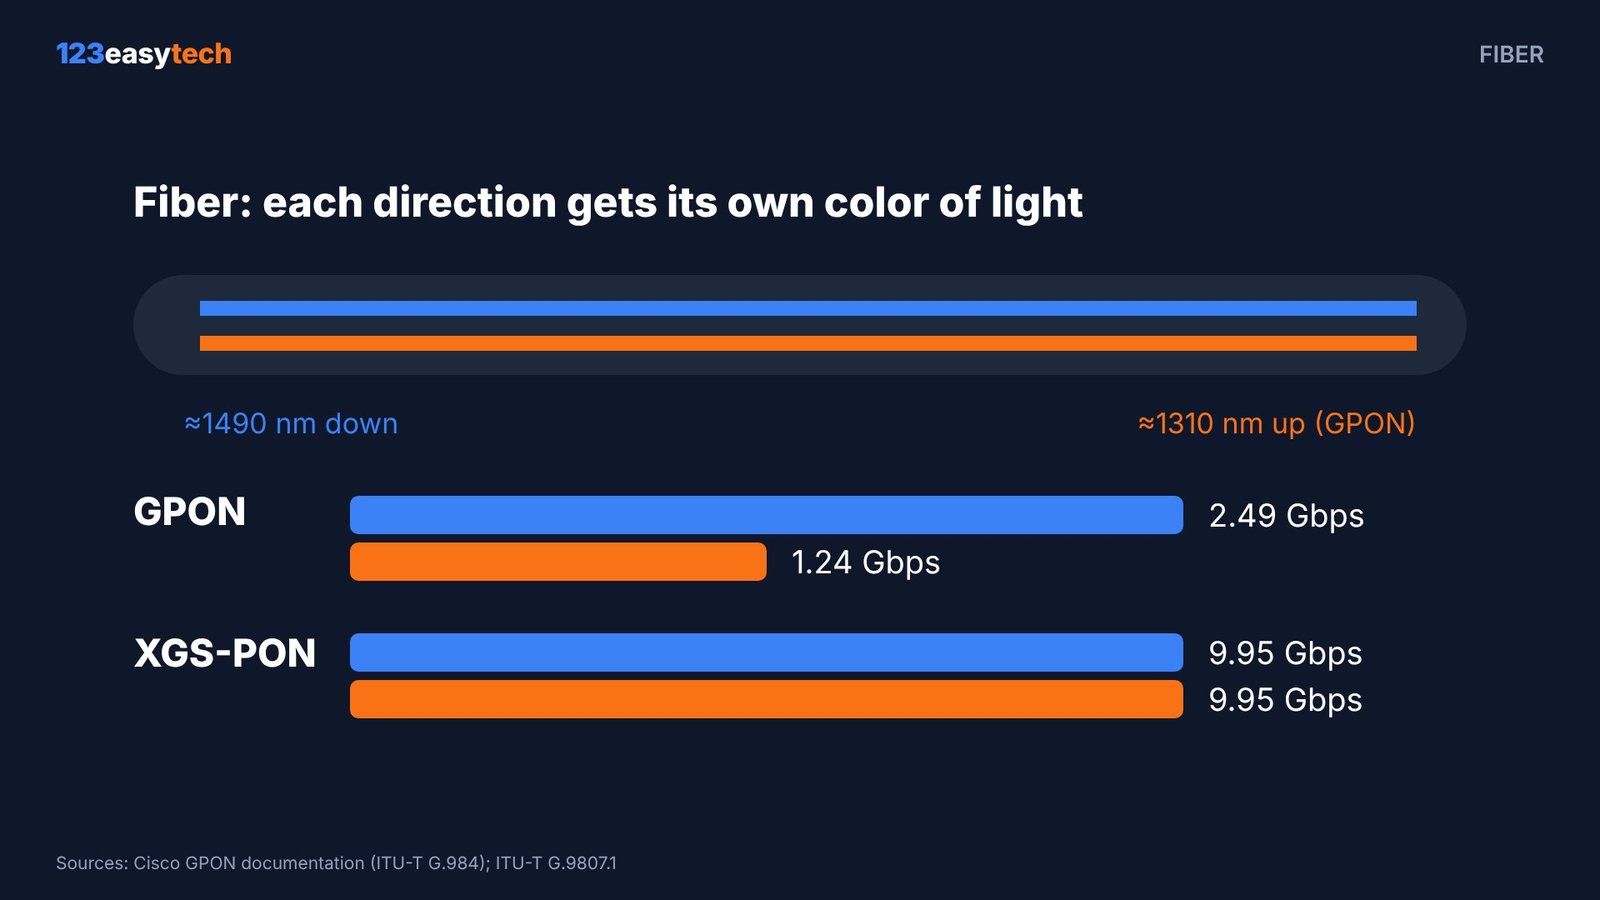
Fiber sends each direction on its own wavelength of light (around 1490 nm down and 1310 nm up on GPON), so neither direction takes room from the other. The most common GPON setup runs 2-to-1: 2.488 Gbps down and 1.244 Gbps up, shared by the homes on one splitter. That is still enough upstream for many matching-speed plans (Cisco). The newer XGS-PON runs at about 9.95 Gbps both ways (ITU-T G.9807.1; ITU flyer), which extends matching speeds to multi-gigabit plans.
Cable is moving the dividing line
Cable operators are widening the upload band: mid-split to about 85 MHz and high-split to about 204 MHz (VeEX). The DOCSIS 4.0 specification targets up to 10 Gbps down and 6 Gbps up, with “symmetrical multi-gigabit” service as the goal (CableLabs). Spec maximums are network capacity. What you can buy depends on your provider and area.
Why this matters now
Uploads are growing faster than total usage. OpenVault measured average upload volume per subscriber up 21.7% in a year, against 9.9% for total traffic. Video calls, cloud backups and anyone posting video feel the upload limit first.
Test it yourself (5 minutes)
- Run a speed test on a computer plugged in with an Ethernet cable, then repeat it on Wi-Fi.
- Find “Typical Upload Speed” on your plan’s broadband label (in your provider account or on its website).
- If the wired result roughly matches the label, your plan or technology is the limit. Ask about a higher upload tier, or check whether fiber (XGS-PON) is available.
- If wired is fine but Wi-Fi upload is low, the problem is inside your home: router placement, an older device, or interference.
- If both are well below the label, contact your provider.
Useful question for your provider: “Is my service GPON or XGS-PON?” or “Is your cable network mid-split or high-split, and is DOCSIS 4.0 available here?”
Key takeaways
- Upload is slower because shared capacity is split mostly toward download, which matches how people use the internet.
- Cable, DSL, 5G and common GPON fiber setups build that split into their standards. Your plan tier narrows it further.
- Fiber can offer matching speeds (XGS-PON is symmetric at about 10 Gbps), and cable upgrades (high-split, DOCSIS 4.0) are widening the upload lane.
Sources
- OpenVault, Q4 2025 broadband usage (Feb 17, 2026): openvault.com
- GSMA, 3.5 GHz 5G TDD Synchronisation (Apr 2020): gsma.com
- VeEX, What is mid-split and high-split DOCSIS: kb.veexinc.com
- CableLabs, DOCSIS 4.0 Technology: cablelabs.com
- ITU-T G.992.1, ADSL transceivers (1999): itu.int
- University of British Columbia, ECE lecture 5 (DSL): ubc.ca
- Cisco, Understand GPON Technology: cisco.com
- ITU-T G.9807.1, XGS-PON: itu.int
- FCC 24-27, Section 706 Report (Mar 2024): fcc.gov
- FCC, Broadband Labels glossary: fcc.gov
Related on 123easytech
- Best MoCA adapters: wired speed over your home’s coax
- Free device tests: mouse, keyboard, mic, webcam and screen
Diagrams are original 123easytech illustrations, drawn from the sources above.
